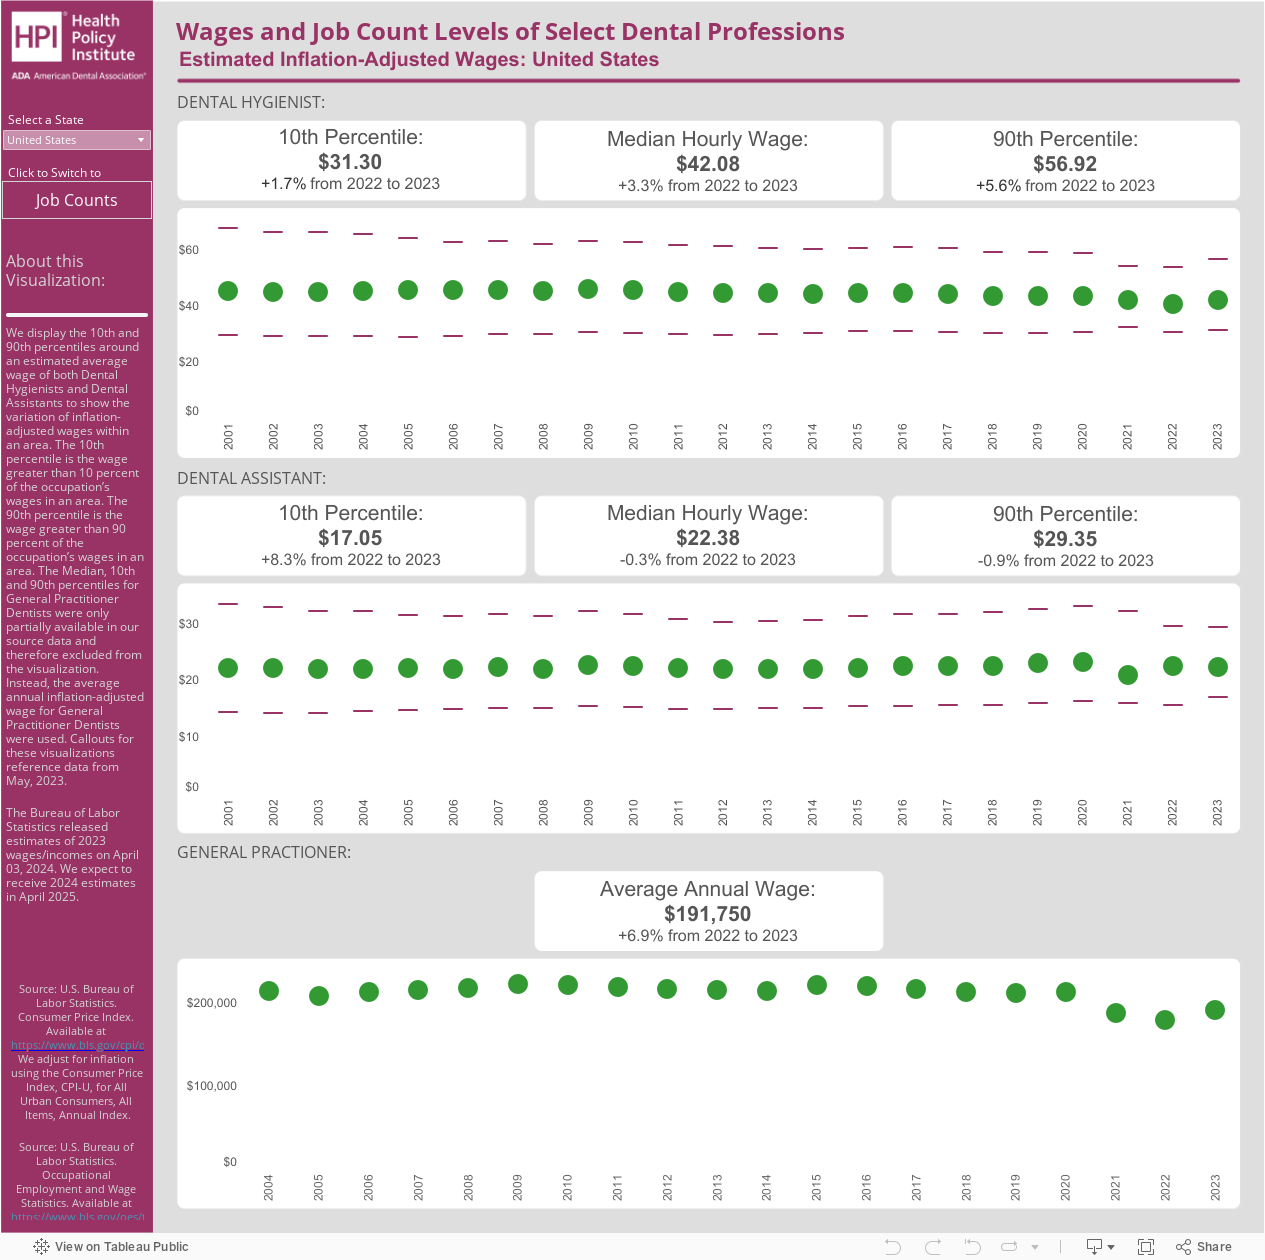
The dashboard below represents wages and job counts (or supply) of dental hygienists, dental assistants, and general practitioner dentists in each state for the years 2001-2022. Wages are hourly for hygienists and assistants and annual for general dentists. For more information on how we adjusted earnings data for inflation, see our Data & Methods (PDF) document.
Use the view buttons to toggle between the wages view and the job counts view of the dashboard. Use the drop-down menu to select a specific state. Data are from the U.S. Bureau of Labor Statistics.
For a count of all general practitioner dentists and specialist dentists by state and other demographics, see HPI's Supply of Dentists report (XLSX).
For state-level demographics data of dentists, see our Dentist Demographics Dashboard.