- U.S. dentist demographics dashboard in Tableau
- Dentist migration across state lines dashboard in Tableau and data report (XLSX)
- Dental workforce wages and job counts dashboard in Tableau
- Supply of dentists in the U.S.: 2001-2023 (XLSX)
- Dentist workforce shortages: data to navigate today's labor market (PDF)
- Dentist retirement and career span trends
The dentist workforce
Insights from the ADA Health Policy Institute on the current and future supply of dentists and shifting demographics within the workforce.
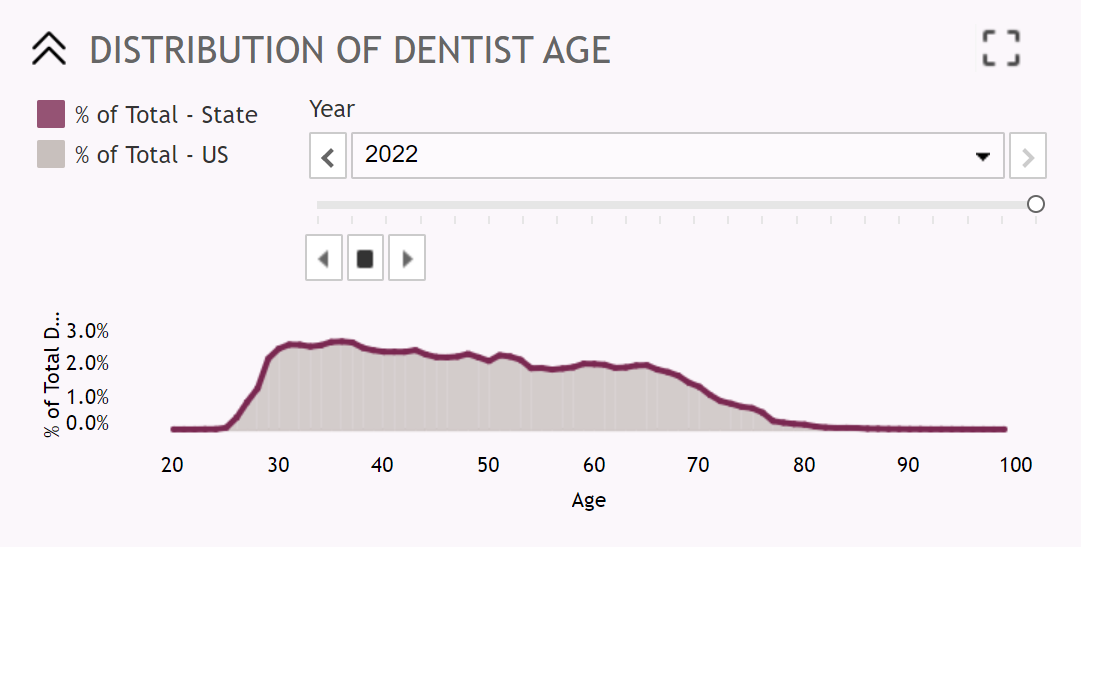
U.S. Dentist Demographics
View state-level data on dentist age, gender, race/ethnicity, and supply per capita.
Top publications
How has dental practice ownership differed by dentist generation and career span?
Download
See how many dentists left, entered, and remained in your state from 2019 to 2022.
Landing page
More research and insights
Data reports and dashboards
Journal articles
- We are in the midst of a major generational transition in dentistry (January 2025)
- Workplace factors associated with job satisfaction among dental hygienists and assistants in the United States (January 2025)
- A closer look at disparities in earnings between white and minoritized dentists (November 2022)
- US dental health care workers’ mental health during the COVID-19 pandemic (August 2022)
- Dentists who participate in Medicaid: Who they are, where they locate, how they practice (July 2022)
- COVID-19 vaccine intention and hesitancy of dental hygienists in the United States (PDF) (February 2022)
- Infection prevention and control practices of dental hygienists in the United States during the COVID-19 pandemic: a longitudinal study (PDF) (February 2022)
- Employment patterns of dental hygienists in the United States during the COVID-19 pandemic: an update (PDF) (February 2022)
- Elevating dentistry through diversity (April 2021)
- Employment patterns of dental hygienists in the United States during the COVID-19 pandemic (PDF) (February 2021)
- COVID-19 prevalence and related practices among dental hygienists in the United States (PDF) (February 2021)
- Practice ownership is declining (September 2017)
- Will we see more foreign-trained dentists in the United States? (July 2017)
- Does California project the future of dentistry? (January 2017)
- Do dentists from rural areas practice in rural areas? (December 2016)
- The “de-aging” of the dentist workforce (October 2016)
- Is the number of Medicaid providers really that important? (March 2016)
- Rethinking dentist shortages (May 2015)
Infographics
- Practice ownership among dentists continues to decline (PDF) (November 2023)
- Racial and ethnic mix of the dentist workforce in the U.S. (PDF) (April 2021)
- Racial and ethnic mix of dental students in the U.S. (PDF) (April 2021)
- The dentist workforce - key facts (PDF) (February 2021)
Research briefs
- Practice ownership trends in dentistry: A new look at old data (PDF) (June 2025)
- Estimating the impact of Medicaid expansions on dentist supply (PDF) (August 2021)
- Projected supply of dentists in the United States, 2020-2040 (PDF) (May 2021)
Webinars
- The evolving dental practice model (PDF) (May 2023)
- Dentist workforce shortages: data to navigate today's labor market (October 2022)
- Who goes into postgraduate dental training and what do they do after? (September 2022)
- The changing dentist workforce (March 2022)
Dentist workforce FAQs
As of 2023, there are 202,304 professionally active dentists in the U.S. There are 60.4 dentists per 100,000 U.S. population. Ratios vary by state.
Sources: Supply of Dentists in the U.S.: 2001-2023 (XLSX) and dental workforce wages and job counts dashboard in Tableau.
No. It is the ADA’s view that a simple dentist-to-patient ratio cannot take into account the differing economic environments from region to region, state to state, or urban to rural.
For further explanation, see: Is the Number of Medicaid Providers Really that Important? (JADA).
Among the 202,304 dentists working in dentistry as of 2023, 37.7% are female.
Source: Supply of Dentists in the U.S.: 2001-2023 (XLSX).
As of 2023, about one in five professionally active dentists (21.3%) reported that their practice, research, or administration area is an ADA-recognized specialty.
Source: Supply of Dentists in the U.S.: 2001-2023 (XLSX).
Among the 202,304 dentists working in dentistry as of 2023, 17.4% are under age 35, 25.5% are ages 35-44, 22.4% are ages 45-54, 18.9% are ages 55-64, and 15.8% are age 65 and older.
Source: Supply of Dentists in the U.S.: 2001-2023 (XLSX).
As of 2022, 68.4% of U.S. dentists are White, 19.4% are Asian, 5.9% are Hispanic, 3.8% are Black, and 2.0% are other race/unknown.
Source: U.S. Dentist Demographics Dashboard in Tableau
In 2023, the average age of retirement among U.S. dentists was 68.9, up from 68.1 in 2022.
As of 2022, there are 214,700 dental hygienists and 363,880 dental assistants working in the U.S. Supply of hygienists and assistants is available at the state-level.
Source: Dental workforce wages and job counts dashboard in Tableau.
The research brief Projected Supply of Dentists in the United States, 2020-2040 projects the future supply of dentists in the U.S. based on various sources of outflows from and inflows to the dental profession. Find full details in the brief.
Source: Projected Supply of Dentists in the United States, 2020-2040 (PDF) (HPI Research Brief).